Seasonally adjusted and unadjusted data are two important figures that play a crucial role in economic analysis. Understanding the difference between these two types of data is essential for making informed decisions and predictions in various industries. In this article, we will delve into the significance of seasonally adjusted data versus unadjusted data, and explore the implications of using each figure in different scenarios.
The Importance of Seasonally Adjusted Data
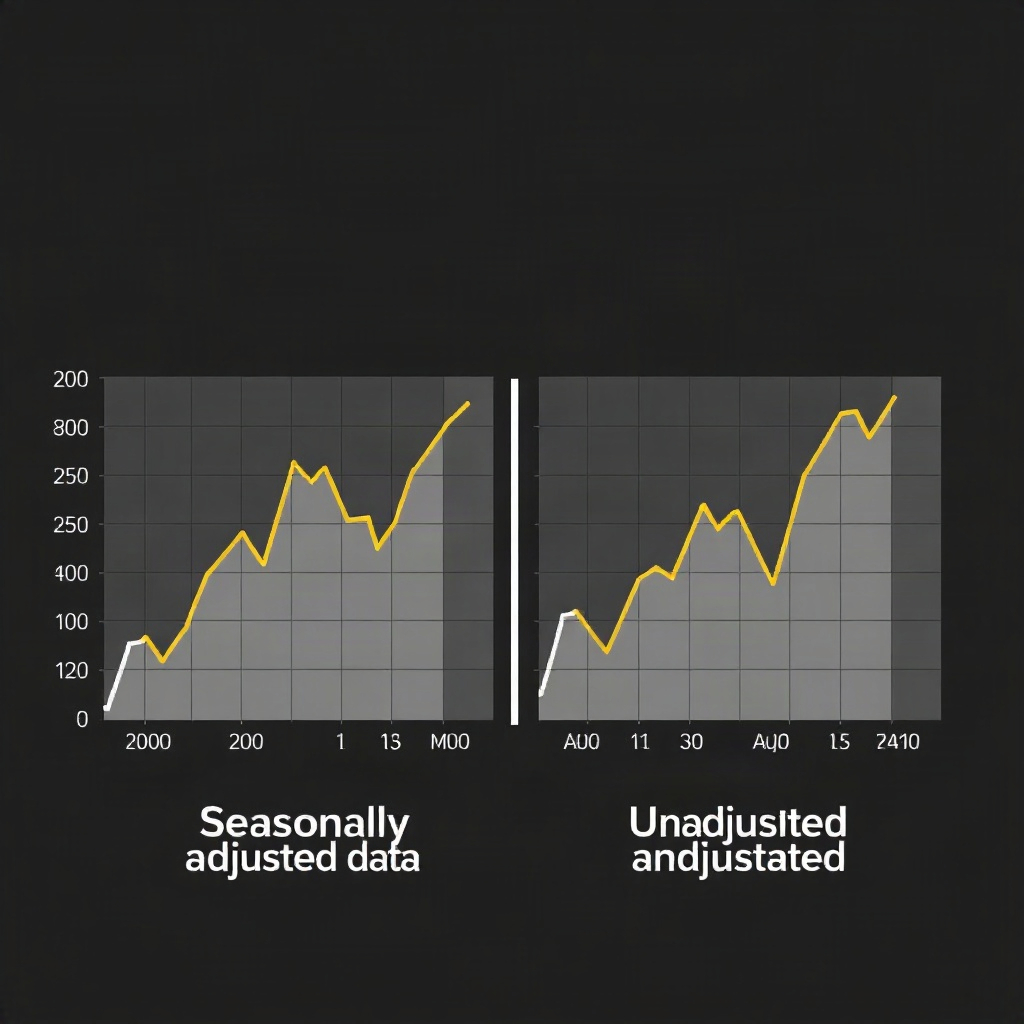
Seasonally adjusted data is a statistical method used to remove the effects of seasonal variations in data. It provides a clearer picture of underlying trends by eliminating the impact of seasonal fluctuations, such as holidays, weather patterns, or other recurring events. This type of data is particularly useful in industries where seasonal factors can distort the true performance of a variable, such as retail sales, tourism, or agriculture.
The Significance of Unadjusted Data
On the other hand, unadjusted data represents the raw figures without any seasonal adjustments. While this type of data may provide a more accurate representation of short-term fluctuations, it can be misleading when analyzing long-term trends or making comparisons across different time periods. Unadjusted data is commonly used in industries where seasonal variations are minimal or when the focus is on short-term changes.
Factors to Consider When Choosing Data Figures
When deciding whether to use seasonally adjusted or unadjusted data, it is important to consider the specific characteristics of the industry or variable being analyzed. For example, industries with strong seasonal patterns, such as retail or tourism, may benefit more from using seasonally adjusted data to reveal true underlying trends. On the other hand, industries with minimal seasonal fluctuations, such as healthcare or utilities, may find unadjusted data more suitable for accurate analysis.
The Impact of Data Figures on Decision Making
The choice between seasonally adjusted and unadjusted data can have a significant impact on decision-making processes. Using the wrong type of data figure can lead to misinterpretation of trends, inaccurate predictions, and flawed strategic planning. It is crucial for analysts and decision-makers to carefully evaluate the pros and cons of each type of data before drawing conclusions or making critical decisions.
Best Practices for Utilizing Data Figures
To ensure the accuracy and reliability of analysis, it is recommended to compare seasonally adjusted and unadjusted data side by side. This approach allows for a comprehensive understanding of both short-term fluctuations and long-term trends, providing a more holistic view of the variable under scrutiny. Additionally, using a combination of both data figures can help mitigate the limitations of each type and offer a more balanced perspective for decision-making.
Conclusion
In conclusion, seasonally adjusted data and unadjusted data serve distinct purposes in economic analysis, each offering unique insights into the performance of variables over time. While seasonally adjusted data removes the noise of seasonal fluctuations, unadjusted data provides a raw and unfiltered view of short-term changes. By understanding the differences between these two types of data and selecting the most appropriate figure for each scenario, analysts and decision-makers can enhance the accuracy and effectiveness of their strategic planning and forecasting processes.